
What 35 Years of Data Taught Me About Investing
(And Why I Keep Coming Back to the Same Conclusions)
I'll be honest with you: I love data. I always have. There is something deeply satisfying about sitting down with a spreadsheet full of numbers and not leaving until they have told me something true. It is one of the reasons I do this work.
Recently I spent several days building an interactive Periodic Table of Investment Returns — a tool that lets you visualize how 9 major asset classes have ranked against each other in every calendar year from 1990 through 2025. You can toggle between rolling 5-year, 10-year, and 20-year periods. You can hover over any asset class and watch it light up across the full history. You can slide through every 20-year window we have experienced in the modern investment era.
It is my kind of toy.
And every time I build something like this — every time I run the numbers yet again — I come away believing exactly what I believed before. Because the data, over and over, keeps saying the same thing.
Predicting markets is a fool's errand. Chasing what's hot is a losing strategy. Diversification, patience, and discipline win over the long run.
Here is what the data actually showed me this time.
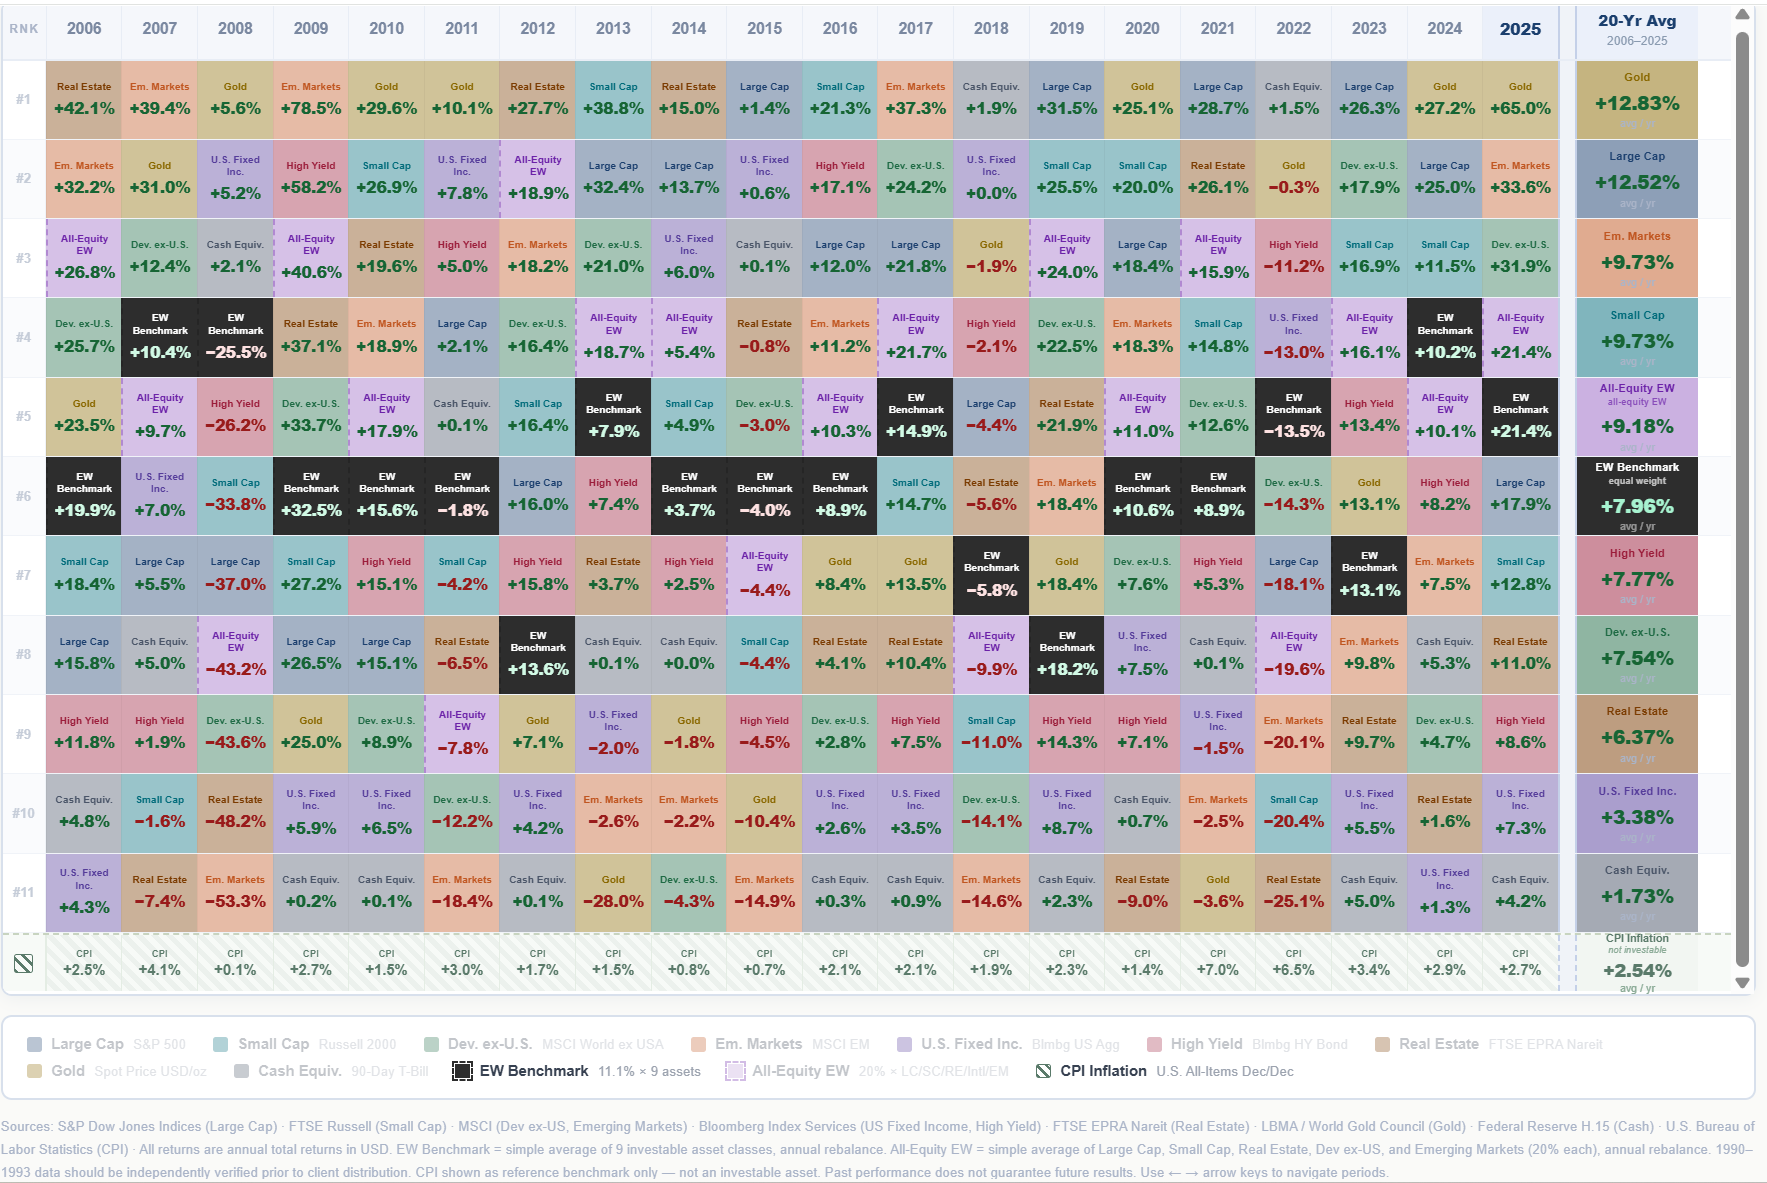
Berkshire Wealth Group Periodic Table of Investment Returns
9 asset classes + equal-weight benchmarks · 20-year periods · 2006–2025
The Periodic Table Doesn't Lie
The original Periodic Table of Investment Returns was popularized by Callan Associates, and financial advisors have used versions of it for decades to illustrate one simple point: the best-performing asset class changes every single year. There is no pattern. There is no reliable rotation.
Looking at the data from 1990 through 2025 across 9 major asset classes — U.S. large cap stocks, small cap stocks, developed international equities, emerging markets, U.S. bonds, high yield bonds, real estate, gold, and cash — the top performer changes constantly. Emerging markets were up 74.8% in 1993 and down 25.3% in 1998. Real estate gained 42.1% in 2006 and fell 48.2% in 2008. Gold lost 28.0% in 2013 — and gained 65.0% in 2025, its best year since 1979.
If someone tells you they know what will lead next year, they are guessing. The data makes that unmistakably clear.
Buying What's Hot: A Study in Disappointment
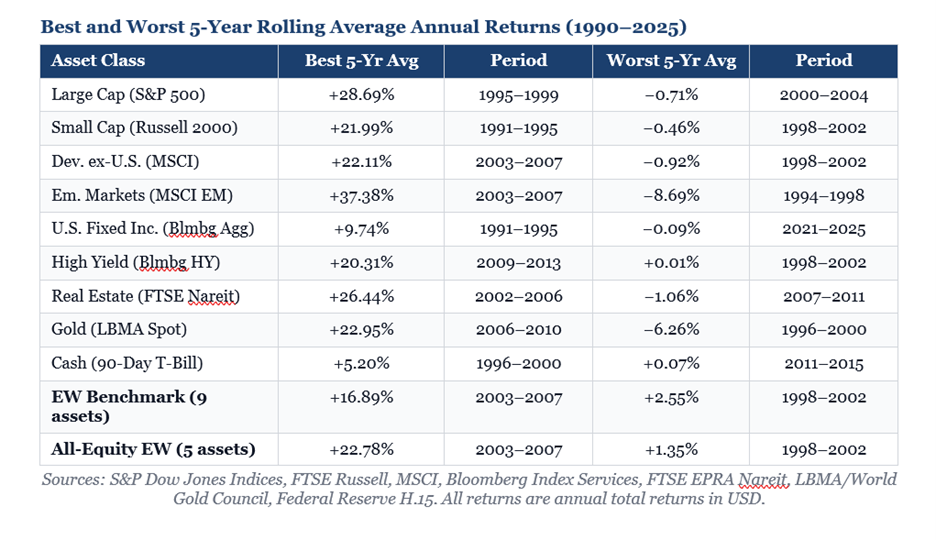
The table becomes even more instructive when you look at rolling multi-year periods. I calculated the best and worst 5-year, 10-year, and 20-year average annual returns for each asset class in our 1990–2025 dataset. The pattern that emerges is consistent and humbling.
Take U.S. large cap stocks. Their best 5-year run was 1995–1999, averaging +28.7% per year — the peak of the dot-com bubble. An investor who saw that performance and decided to go all-in on U.S. large caps heading into the 2000s walked straight into the worst 5-year period in this dataset: 2000–2004, averaging −0.7% per year.
Emerging markets told the same story. Best 5-year average: +37.4% during 2003–2007. Then came the financial crisis and the lost decade that followed.
This is the trap of performance chasing. By the time an asset class has produced its best stretch of returns, the conditions that drove those returns are often already priced in — or reversing. You end up buying the ticket after the show.
Diversification: The One Free Lunch That Actually Works
Here is the finding that I want every client I work with to internalize.
In every single 20-year rolling window available in this dataset — all 17 of them — every asset class produced a positive average annual return. Not one asset class, over any 20-year period from 1990 to 2025, lost money on average. Not even the ones that had brutal single years or terrible decades.
Time is the great equalizer. The longer your horizon, the more the noise fades and the fundamental return on human productivity and capital asserts itself.
But what about diversification specifically? I built two benchmark portfolios into the tool to test this. The first is an equal-weight blend of all 9 investable asset classes (roughly 11% each, rebalanced annually). The second is an equal-weight blend of the 5 major equity categories — U.S. large cap, small cap, real estate, developed international, and emerging markets — at 20% each.
The results are striking. The diversified equal-weight benchmark never had a negative 5-year period. Its worst 5-year average was +2.55% — a stretch (1998–2002) that was catastrophic for most individual asset classes. Meanwhile, U.S. large cap stocks averaged −0.71% per year over that same period.
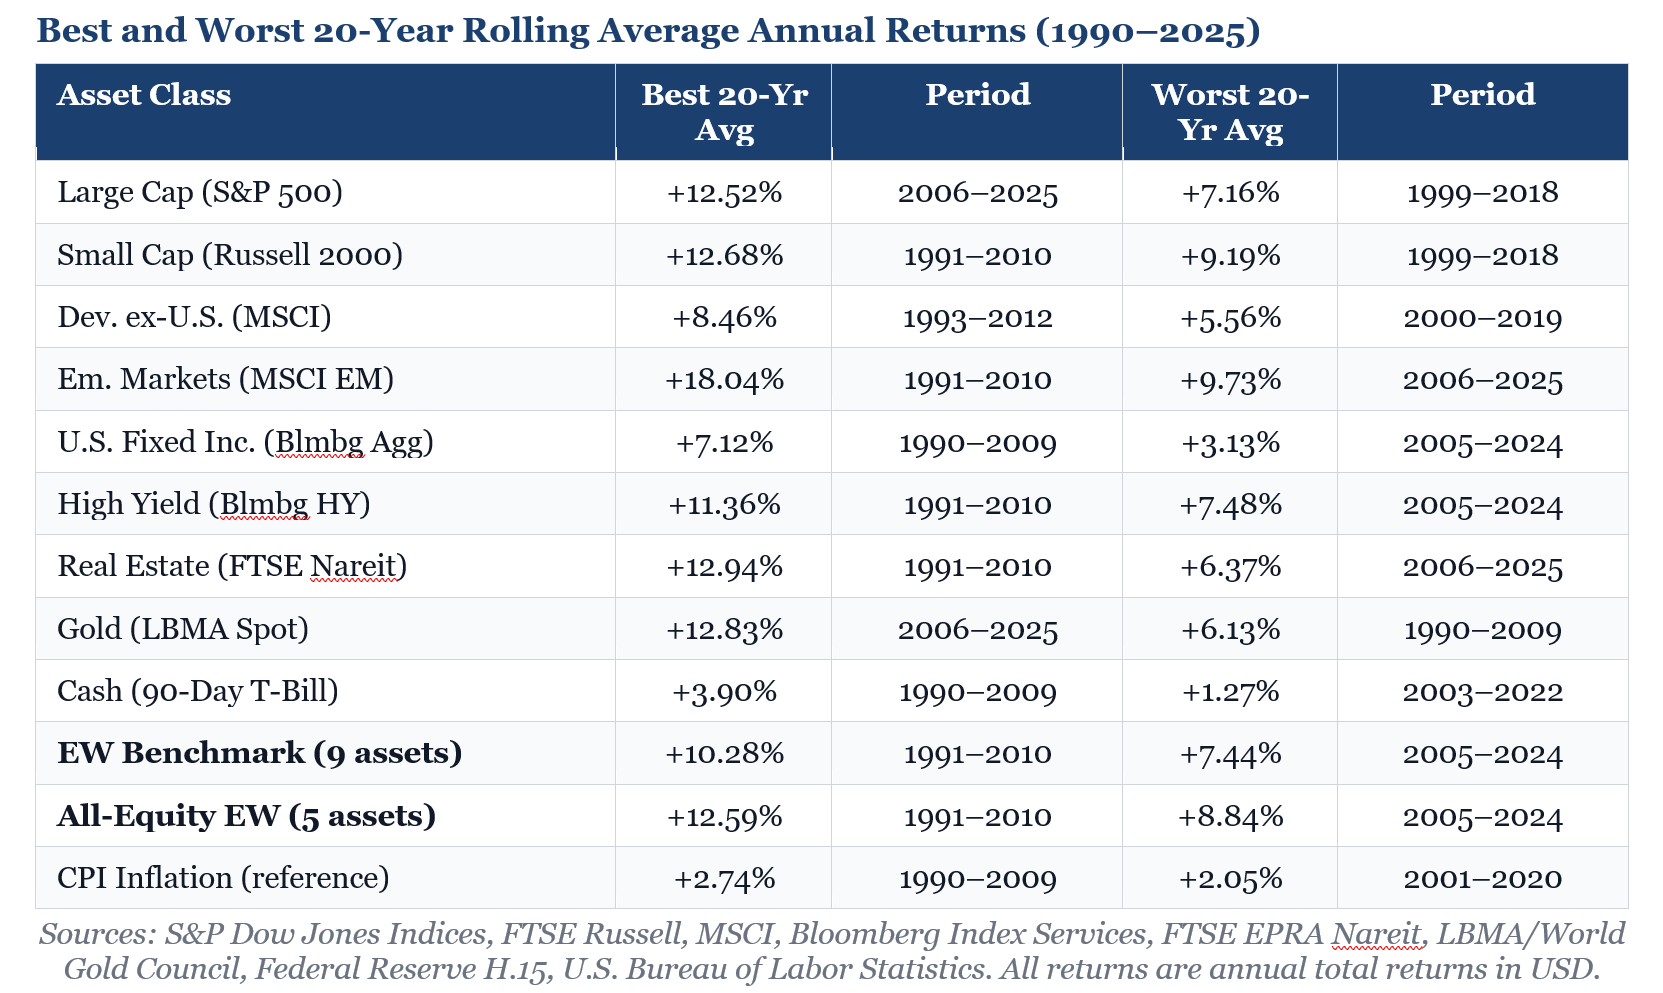
The EW benchmark's worst 20-year average, +7.44%, beats the worst 20-year average of 7 out of 9 individual asset classes. Diversification does not just reduce volatility. It raises the floor.
The Rebalancing Engine
One detail worth highlighting: both benchmarks assume annual rebalancing back to equal weights. This is not incidental. Rebalancing is the mechanism that forces you to sell what has gotten expensive and buy what has gotten cheap — systematically, without emotion, every year.
It is the investment equivalent of what I try to teach in my yoga practice: you do not perform at your best by doing more of what already feels natural. You grow by returning, again and again, to balance. The practice itself is the point.
Trimming your winners and adding to your laggards feels deeply unnatural. Every instinct says to do the opposite. But the data suggests that discipline — repeated, year after year, across a diversified set of assets — is one of the most powerful tools available to long-term investors.
What I Believe (Because the Data Keeps Saying So)
I have been in this industry for nearly 30 years. I made the full shift to evidence-based investing about 8 years ago, after extensive back-testing showed me what rigorous, peer-reviewed academic research had been saying for decades. The experience of building and studying tools like this periodic table only reinforces what I now know to be true:
Markets are largely unpredictable in the short term. Anyone who tells you otherwise is selling something.
Asset class leadership rotates constantly and without warning. This year's hero is often next year's laggard.
Diversification is not a consolation prize for not knowing what will outperform. It is the structurally sound response to genuine uncertainty.
Time horizons matter enormously. Over 20 years, no asset class in our dataset ever lost money. The math of long-term compounding is on the side of the patient investor.
Rebalancing is not just maintenance — it is return. The discipline of buying low and trimming high, applied consistently over decades, adds meaningful value.
The goal is not to predict the future. The goal is to build a portfolio that does not require you to.
If you would like to explore the interactive Periodic Table of Investment Returns yourself, I have made it available at the link here. Slide through the rolling windows. Hover over asset classes. Watch how the table shifts across different periods of history. I think you will find, as I do, that the more time you spend with the data, the quieter the noise becomes.
Data Sources
All return data represents annual total returns in USD.
U.S. Large Cap: S&P 500 Total Return Index — S&P Dow Jones Indices
U.S. Small Cap: Russell 2000 Total Return Index — FTSE Russell
Dev. ex-U.S.: MSCI World ex USA Index (gross returns) — MSCI
Emerging Markets: MSCI Emerging Markets Index (gross returns) — MSCI
U.S. Fixed Income: Bloomberg U.S. Aggregate Bond Index — Bloomberg Index Services
High Yield: Bloomberg U.S. High Yield Corporate Bond Index — Bloomberg Index Services
Real Estate: FTSE EPRA Nareit Global Real Estate Index (USD) — FTSE Russell / Nareit
Gold: LBMA Gold Price (London PM Fix, year-end to year-end) — LBMA / World Gold Council
Cash: 90-Day U.S. Treasury Bill — Federal Reserve H.15 Release
CPI: Consumer Price Index for All Urban Consumers (CPI-U), Dec/Dec — U.S. Bureau of Labor Statistics
EW Benchmark = simple average annual return of 9 investable asset classes, assuming annual rebalancing to equal weight.
All-Equity EW = simple average annual return of Large Cap, Small Cap, Real Estate, Dev. ex-U.S., and Emerging Markets, assuming annual rebalancing to equal weight.
Note: 1990–1993 data should be independently verified prior to formal distribution. Data from 1994 onward has been verified against primary index provider sources.
Past performance is not indicative of future results. Index returns are provided for illustrative purposes only and do not represent actual investment results. Indexes are unmanaged and do not incur management fees, transaction costs, or other expenses associated with investable products. It is not possible to invest directly in an index. This article is intended for educational purposes and does not constitute investment advice. additional disclosures:
Investing involves risk and you may incur a profit or loss regardless of strategy selected, including diversification and asset allocation.
The S&P 500 is an unmanaged index of 500 widely held stocks that is generally considered representative of the U.S. stock market.
The Russell 2000 Index measures the performance of the 2,000 smallest companies in the Russell 3000 Index, which represent approximately 8% of the total market capitalization of the Russell 3000 Index.
The MSCI is an index of stocks compiled by Morgan Stanley Capital International. The index consists of more than 1,000 companies in 22 developed markets.
The MSCI Emerging Markets is designed to measure equity market performance in 25 emerging market indices. The index's three largest industries are materials, energy, and banks.
The Bloomberg Barclays US Aggregate Bond Index is a broad-based flagship benchmark that measures the investment grade, US dollar-denominated, fixed-rate taxable bond market.
The Bloomberg Barclays U.S. Corporate High Yield Bond Index is composed of fixed-rate, publicly issued, non-investment grade debt, is unmanaged, with dividends reinvested, and is not available for purchase. The index includes both corporate and non-corporate sectors. The corporate sectors are Industrial, Utility and Finance, which include both U.S. and non-U.S. corporations.
The FTSE EPRA/NAREIT Global Real Estate Index Series is designed to represent general trends in eligible listed real estate stocks worldwide. Relevant real estate activities are defined as the ownership, trading and development of income producing real estate.
Treasury Bills are certificates reflecting short-term (under one year) obligations of the U.S. government.
Gold is subject to the special risks associated with investing in precious metals, including but not limited to: price may be subject to wide fluctuation; the market is relatively limited; the sources are concentrated in countries that have the potential for instability; and the market is unregulated.
Every investor's situation is unique and you should consider your investment goals, risk tolerance and time horizon before making any investment. Prior to making an investment decision, please consult with your financial advisor about your individual situation.
The foregoing information has been obtained from sources considered to be reliable, but we do not guarantee that it is accurate or complete, it is not a statement of all available data necessary for making an investment decision, and it does not constitute a recommendation. Any opinions are those of Katherine Reisfeld and not necessarily those of Raymond James.